| United States National Debt | |
| United States National Debt Per Person | |
| United States National Debt Per Household | |
| Total US Unfunded Liabilities | |
| Social Security Unfunded Liability | |
| Medicare Unfunded Liability | |
| Prescription Drug Unfunded Liability | |
| National Healthcare Unfunded Liability | |
| Total US Unfunded Liabilities Per Person | |
| Total US Unfunded Liabilities Per Household | |
| United States Population |

| |
|
|
|
|
|
|
|
|
|
|
|
|
|
|
|
|
|
|
|
|
|
|
|
|
|
|
|
|
|
|
|
|
|
|
|
|
|
|
|
|
|
|
|
|
|
|
|
|
|
|
|
|
|
|
|
|
|
|
|
|
|---|
MEDIA
756.75
for the week just ended
+7.38
Healthcar
1437.00
for the week just ended
-27.00
Energy
262.50
for the week just ended
+7.50
Nickel In
171.88
for the week just ended
-.25
SFTCPTRSR
8055.00
for the week just ended
+113.00
100 TECHN
12281.00
for the week just ended
-505.00
AEROSPACE
3731.00
for the week just ended
+18.00
CONSUMGDS
1034.00
for the week just ended
-4.00


30 Dow Jones Industrial Stocks
20 Dow Jones Transportation Stocks
15 Dow Jones Utility Stocks
| 64 week
|
|
||||||||||||
|---|---|---|---|---|---|---|---|---|---|---|---|---|---|
| High....... | Low........ | Symbol | Name.......................................... | Recommendation |
THURSDAY........
Close.... |
Share....
Volume... |
Earnings | P/E... Ratio... |
Div.. | Yield | |||
| |
|
|
|
|
|
|
|
|
|
|
|||
| |
|
|
|
|
|
|
|
|
|
|
|||
| |
|
|
|
|
|
|
|
|
|
|
|||
| |
|
|
|
|
|
|
|
|
|
|
|||
| |
|
|
|
|
|
|
|
|
|
|
|||
| |
|
|
|
|
|
|
|
|
|
|
|||
| |
|
|
|
|
|
|
|
|
|
|
|||
| |
|
|
|
|
|
|
|
|
|
|
|||
| |
|
|
|
|
|
|
|
|
|
|
|||
| |
|
|
|
|
|
|
|
|
|
|
|||
| |
|
|
|
|
|
|
|
|
|
|
|||
| |
|
|
|
|
|
|
|
|
|
|
|||
| |
|
|
|
|
|
|
|
|
|
|
|||
| |
|
|
|
|
|
|
|
|
|
|
|||
| |
|
|
|
|
|
|
|
|
|
|
|||
| |
|
|
|
|
|
|
|
|
|
|
|||
| |
|
|
|
|
|
|
|
|
|
|
|||
| |
|
|
|
|
|
|
|
|
|
|
|||
| |
|
|
|
|
|
|
|
|
|
|
|||
| |
|
|
|
|
|
|
|
|
|
|
|||
| |
|
|
|
|
|
|
|
|
|
|
|||
| |
|
|
|
|
|
|
|
|
|
|
|||
| |
|
|
|
|
|
|
|
|
|
|
|||
| |
|
|
|
|
|
|
|
|
|
|
|||
| |
|
|
|
|
|
|
|
|
|
|
|||
| |
|
|
|
|
|
|
|
|
|
|
|||
| |
|
|
|
|
|
|
|
|
|
|
|||
| |
|
|
|
|
|
|
|
|
|
|
|||
| |
|
|
|
|
|
|
|
|
|
|
|||
| |
|
|
|
|
|
|
|
|
|
|
|||
| |
|
|
|
|
|
|
|
|
|
|
|||
| |
|
|
|
|
|
|
|
|
|
|
|||
| |
|
|
|
|
|
|
|
|
|
|
|||
| |
|
|
|
|
|
|
|
|
|
|
|||
| |
|
|
|
|
|
|
|
|
|
|
|||
| |
|
|
|
|
|
|
|
|
|
|
|||
| |
|
|
|
|
|
|
|
|
|
|
|||
| |
|
|
|
|
|
|
|
|
|
|
|||
| |
|
|
|
|
|
|
|
|
|
|
|||
| |
|
|
|
|
|
|
|
|
|
|
|||
| |
|
|
|
|
|
|
|
|
|
|
|||
| |
|
|
|
|
|
|
|
|
|
|
|||
| |
|
|
|
|
|
|
|
|
|
|
|||
| |
|
|
|
|
|
|
|
|
|
|
|||
| |
|
|
|
|
|
|
|
|
|
|
|||
| |
|
|
|
|
|
|
|
|
|
|
|||
| |
|
|
|
|
|
|
|
|
|
|
|||
| |
|
|
|
|
|
|
|
|
|
|
|||
| |
|
|
|
|
|
|
|
|
|
|
|||
| |
|
|
|
|
|
|
|
|
|
|
|||
| |
|
|
|
|
|
|
|
|
|
|
|||
| |
|
|
|
|
|
|
|
|
|
|
|||
| |
|
|
|
|
|
|
|
|
|
|
|||
| |
|
|
|
|
|
|
|
|
|
|
|||
| |
|
|
|
|
|
|
|
|
|
|
|||
| |
|
|
|
|
|
|
|
|
|
|
|||
| |
|
|
|
|
|
|
|
|
|
|
|||
| |
|
|
|
|
|
|
|
|
|
|
|||
| |
|
|
|
|
|
|
|
|
|
|
|||
| |
|
|
|
|
|
|
|
|
|
|
|||
| |
|
|
|
|
|
|
|
|
|
|
|||
| |
|
|
|
|
|
|
|
|
|
|
|||
| |
|
|
|
|
|
|
|
|
|
|
|||
| |
|
|
|
|
|
|
|
|
|
|
|||
| |
|
|
|
|
|
|
|
|
|
|
|||


The English Language WordClock:
In
Donald J. Trump will no longer be the President of the United States...
NOT MORE THAN 1 YEAR...and c-o-u-n-t-ing...
In
...it is now


BANKING SYSTEM will COLLAPSE ...
NOT MORE THAN 19 YEARS...and c-o-u-n-t-ing...


 Federal Election Commission
U n i t e d S t a t e s - of - A m e r i c a
President REAGAN has accumulated a DEBT of $ 1700000038912.00 IN 2922 DAYS
President TRUMP has accumulated a DEBT of $ 2218752000000.00 IN 535 DAYS
President TRUMP is accelerating RED INK (the NATIONAL DEBT)
====warning====> 7.13 TIMES greater than President REAGAN!
President TRUMP is adding to the NATIONAL DEBT faster
than all other PRESIDENTs combined by 12.33%
President(37) NIXON left office with a U.S. debt of $ 250,000,000,000
President(38) FORD left office with a U.S. debt of $ 500,000,000,000
President(39) CARTER left office with a U.S. debt of $ 750,000,000,000
President(40) REAGAN left office with a U.S. debt of $ 1,700,000,000,000
President(41) BUSH left office with a U.S. debt of $ 3,700,000,000,000
President(42) CLINTON left office with a U.S. debt of $ 5,800,000,000,000
President(43) W BUSH left office with a U.S. debt of $10,600,000,000,000
President(44) OBAMA left office with a U.S. debt of $19,900,000,000,000
President(45) TRUMP left office with a U.S. debt of $27,700,000,000,000
President(46) BIDEN left office with a U.S. debt of $36,777,000,000,000
President(47) TRUMP left office with a U.S. debt of $39,000,000,000,000
President(48) VANCE left office with a U.S. debt of $42,000,000,000,000
President(49) NEWSOM left office with a U.S. debt of $48,000,000,000,000
U.S. NATIONAL DEBT is sinking at the rate of 47297 DOLLARs per second
or 2837820 DOLLARs per minute
or 170269200 DOLLARs per hour
or 4086460800 DOLLARs per day
or 28605225600 DOLLARs per week
or 122593824000 DOLLARs per month
or 1491558192000 DOLLARs per year
Projected U.S. NATIONAL DEBT of $ 39426428000000.00 JUL/09/2026 ??:??:?? GMT
Projected U.S. NATIONAL DEBT of $ 40917986192000.00 JUL/09/2027 ??:??:?? GMT
Projected U.S. NATIONAL DEBT of $ 42409544384000.00 JUL/08/2028 ??:??:?? GMT
Projected U.S. NATIONAL DEBT of $ 43901102576000.00 JUL/08/2029 ??:??:?? GMT
Projected U.S. NATIONAL DEBT of $ 45392660768000.00 JUL/08/2030 ??:??:?? GMT
Projected U.S. NATIONAL DEBT of $ 46884218960000.00 JUL/08/2031 ??:??:?? GMT
Projected U.S. NATIONAL DEBT of $ 48375777152000.00 JUL/07/2032 ??:??:?? GMT
Projected U.S. NATIONAL DEBT of $ 49867335344000.00 JUL/07/2033 ??:??:?? GMT
Projected U.S. NATIONAL DEBT of $ 51358893536000.00 JUL/07/2034 ??:??:?? GMT
Projected U.S. NATIONAL DEBT of $ 52850451728000.00 JUL/07/2035 ??:??:?? GMT
Projected U.S. NATIONAL DEBT of $ 54342009920000.00 JUL/06/2036 ??:??:?? GMT
Projected U.S. NATIONAL DEBT of $ 55833568112000.00 JUL/06/2037 ??:??:?? GMT
Projected U.S. NATIONAL DEBT of $ 57325126304000.00 JUL/06/2038 ??:??:?? GMT
Projected U.S. NATIONAL DEBT of $ 58816684496000.00 JUL/06/2039 ??:??:?? GMT
Projected U.S. NATIONAL DEBT of $ 60308242688000.00 JUL/05/2040 ??:??:?? GMT
Projected U.S. NATIONAL DEBT of $ 61799800880000.00 JUL/05/2041 ??:??:?? GMT
Projected U.S. NATIONAL DEBT of $ 63291359072000.00 JUL/05/2042 ??:??:?? GMT
Projected U.S. NATIONAL DEBT of $ 64782917264000.00 JUL/05/2043 ??:??:?? GMT
Projected U.S. NATIONAL DEBT of $ 66274475456000.00 JUL/04/2044 ??:??:?? GMT
Projected U.S. NATIONAL DEBT of $ 67766033648000.00 JUL/04/2045 ??:??:?? GMT
Projected U.S. NATIONAL DEBT of $ 69257591840000.00 JUL/04/2046 ??:??:?? GMT
Projected U.S. NATIONAL DEBT of $ 70749150032000.00 JUL/04/2047 ??:??:?? GMT
Projected U.S. NATIONAL DEBT of $ 72240708224000.00 JUL/03/2048 ??:??:?? GMT
Projected U.S. NATIONAL DEBT of $ 73732266416000.00 JUL/03/2049 ??:??:?? GMT
Projected U.S. NATIONAL DEBT of $ 75223824608000.00 JUL/03/2050 ??:??:?? GMT
$114,535 U.S. DEBT per PERSON
$1,039,960,730,000 Projected INTEREST payment at interest of 2.64%
$21,000 SAVINGS per PERSON
7,318,435 UNEMPLOYMENT (official U-3) 4.3 percent
13,188,944 UNEMPLOYMENT (actual U-6) 7.5 percent
162,718,196 U.S. WORK FORCE
163,575,232 U.S. WORK FORCE (at full employment) 3.8 percent
63,325,913 U.S. RETIREES 1 retiree per 2.57 workers
36,692,359 FOOD STAMP RECIPIENTS (U.S.D.A. SNAP program)
598,199 Projected BANKRUPTCIES (this year)
72,879 Projected FORECLOSURES (this year)
0 U.S. BANK FAILURES (this year)


(photo taken AUGUST 1, 2010)

NEW YORK CITY IRS
UNITED STATES National Debt Clock I
UNITED STATES National Debt Clock II
UNITED STATES National Debt Clock III
UNITED STATES National Debt Clock IV
UNITED STATES National Debt Clock V
UNITED STATES National Debt Clock VI
UNITED STATES National Debt Clock VII
Complete List of UNITED STATES BANK FAILURES
UNITED STATES Monetary System


History of THE UNITED STATES DEBT

United States National Debt Clock
Current Student Loan Debt in the United States


Credit Cards: $1,300,000,000,000.00
Auto Loans: $1,700,000,000,000.00
Margin Debt: $1,000,000,000,000.00


(photo taken NOVEMBER 15, 2014)

Beijing Square To Watch U.S. National Debt Clock Strike $18 Trillion


Lastest
 Price
Price  by
by County
Lastest
Fuel Prices in Europe
Track United States BAIL OUT PACKAGE
Track United States by STATE BAIL OUT PACKAGE
Track United States Government Spending
CONGRESSIONAL BUDGET OFFICE
Your Tax Dollars At Work
 MANUFACTURING INDEX


 The RICH are getting RICHer
 The Bloomberg Billionaires Index is a daily ranking of rich people


 Some cities are still more unequal than others
 Richest 1% will own more than all the rest by 2016
 The China Money Report
 Millionaires will control half the world's wealth by 2019


 "...in the year TWENTY FORTY..."


"SOUND THE RETREAT"


Shadow Government Statistics
Analysis Behind and Beyond Government Economic Reporting


U.S. WELL BEING Index
CERIDIAN / UCLA Pulse of Commerce Index
|
SmartMoney MAP OF THE MARKET
|


(ummm tight fit)


OPEC: OIL PETROLEUM EXPORT COUNTRIES


(flag of OPEC)


COST of GASOLINE per GALLON (u.s. dollars)
LAST UPDATED 07/09/26 14:14:05
| |
|
 |
|
 |
|
 |
|
|
|
|
|
|
|
 |
|
 |
|
 |
|
|
|
|
|
|
|
 |
|
 |
|
 |
|
|
|
|
|
|
|
 |
|
 |
|
 |
|
|
|
|
|
|
|
 |
|
 |
|
 |
|
|
|
|
|
|
|
 |
|
 |
|
 |
|
|
|
|
|
|
|
 |
|
 |
|
 |
|
|
|
|
|
|
|
 |
|
 |
|
|
|
|
|
|
|
|
|---|


Stock Market World Map
Commodity Futures Markets
Initial Public Offerings I P O s I
Initial Public Offerings I P O s II


PRESIDENTIAL TRACKING POLL


Hey there, all you fascists
Let me put you straight
When you come for the rest of us
We'll fight you at the gate
And you will lose
you fascists bound to lose
We'll battle ICE together
Until they cut and run
Just like in Minneapolis
and when the midterms come
You're bound to lose
You fascists bound to lose
To hell with all the cowards
Who hide behind their masks
We are gonna win the midterms
we're coming for his ass
He knows it too
That bastard's bound to lose
Trying to distract us
From the Epstein files
You gas and beat and murder us
Protecting Pedophiles
Let's turn the screws
You pervs are bound to lose
America get ready
Midterms are at hand
We gotta stick together folks
And vote to save this land
It's time to choose
INVESTMENT ENCYCLOPEDIA
Learn Futures Today


ETFs exchange traded funds
ETFs exchange traded funds DATABASE SEARCH
ETFs exchange traded funds FOREIGN CURRENCY
ETFs exchange traded funds B U L L / B E A R
ETFs exchange traded funds Guide
ETFs exchange traded funds ...and more
ETFs exchange traded funds UNIVERSITY


 Click here for the lastest Sector Performance Map
 Click here for the best Stock BLOG
 Click here for the lastest MONEY ANXIETY INDEX


MORNINGSTAR Ticker Tape
BLOOMBERG Ticker Tape
YAHOO Finanace Ticker Tape
Euro Pacific Capital Ticker Tape (news)
FINANCIAL Finacial Security Index

BLOOMBERG Financials
REALCLEAR Financials
FOX Financials
MISSED FORTUNE RADIO
STRAIGHT MONEY ANALYSIS
Phil's Gang GURUs
More...GURUs
ROB BLACK...GURUs
GET MY GOLD GUIDE ...GURUs
Ray Lucia Your Money, Your Business, Your Life
JILL ON MONEY
TERRY SAVAGE
Trend Research... GURUs
Amateur GURUs
Nest of GURUs
CHRISTIAN MONEY GURUs
Grade the GURUs
STRATEGIC FINANCIAL INTELLIGENCE GURUs
Eric Heckman is a CERTIFIED FINANCIAL PLANNER(r) GURUs

 STOCK Broker
 STOCK Broker
 STOCK Broker
 STOCK Broker
 STOCK Broker (no hidden fees)
 Introducing $0.00 commissions on online stock,
ETF, and option trades for all new and existing clients. When you add
this to our best-in-class platforms, award-winning education and
service, and a network of over 275 branches, you'll see why TD
Ameritrade is the smarter way to trade.
Introducing $0.00 commissions on online stock,
ETF, and option trades for all new and existing clients. When you add
this to our best-in-class platforms, award-winning education and
service, and a network of over 275 branches, you'll see why TD
Ameritrade is the smarter way to trade.
FINANCIAL CONTENT
CHECK ON YOUR ETHICS I
CHECK ON YOUR Broker I
CHECK ON YOUR Broker II
CHECK ON YOUR Broker III

CHECK ON YOUR Broker IV
CHECK ON YOUR Broker V


STOCK LIST:

 NASDAQ 100
STOCK LIST:
 SAN FRANCISCO CHRONICLE 200
STOCK LIST:
commission free ETFs
STOCK LIST:
 FOX 50 FOX BUSINESS CHANNEL
STOCK LIST:
 S&P 500
STOCK LIST:
 Internet 50
STOCK LIST:
 BOTTOM 10 PERCENT VALUE STOCKs
STOCK LIST:
 BLOOMBERG SAN FRANCISCO INDEX
STOCK LIST:
 Jim Cramer's Greatest Hits
STOCK LIST:
 BLOOMBERG BEST STOCKS FOR 2017
STOCK LIST:
 100 BEST STOCKS FOR 2017 [Author: PETER SANDER and SCOTT BOBO]
STOCK LIST:
 THE CARLYLE GROUP
STOCK LIST:
 BLOOMBERG BAY AREA INDEX
STOCK LIST:
 WARREN BUFFETT/BERKSHIRE HATHAWAY PORTFOLIO
STOCK LIST:
 ETFs
ETFs
MAGAZINE:
 THE JOURNAL OF COMMERCE


BONDS, just BONDS
BOND Broker
BUY
 BONDs
BONDs
Salaries
 Pensions
BUY
 "BOND, James Bond"


MONEY Manager
KDOW Business Radio Talk Radio

WORLD POPULATION Counter I
WORLD POPULATION Counter II
Prosperity Index 110 Nations
Prosperity Index UNITED STATES
OCED Better Life Index
MISERY INDEX
WORLD GOLD HOLDINGS

Gold Bugs 10 Year GOLD CHART
Gold Bugs I
Gold Bugs II
Gold Bugs III
Gold Bugs IV
Gold Bugs V
Gold Bugs VI
Gold Bugs VII
Gold Bugs VIII
Gold Bugs IX
Gold Bugs X
Gold Bugs XI
Gold Bugs XII
Gold Bugs XIII
Gold Bugs XIV
Gold Bugs XV
Gold Bugs XVI
Gold Bugs XVII
Gold Bugs XVIII
Gold Bugs XIX
Gold Bugs XX

Gold Bugs XXI
Gold Bugs XXII
Gold Bugs XXIII
Gold Bugs XXIV
Gold Bugs XXV
Gold Bugs XXVI
Gold Bugs XXVII
Gold Bugs XXVIII
Gold Bugs XXIX
Gold Bugs XXX
Gold Bugs XXXI
Gold Bugs XXXII
Gold Bugs XXXIII
Gold Bugs XXXIV
Gold Bugs XXXV
Gold Bugs XXXVI
Gold Bugs XXXVII
Gold Bugs XXXVIII
Gold Bugs XXXIX
Gold Bugs XXXX
Gold Bugs XXXXI
Gold Bugs XXXXII
Gold Bugs XXXXIII
Gold Bugs XXXXIV
Gold Bugs XXXXV
Gold Bugs XXXXVI
Gold Bugs XXXXVII
Gold Bugs XXXXVIII
Gold Bugs XXXXIX
Gold Bugs L
Gold Bugs LI
Gold Bugs LII

Gold Bugs LIII
Gold Bugs LIV
Gold Bugs LV
Gold Bugs LVI
Gold Bugs LVII
Gold Bugs LVIII
Gold Bugs LIX
Gold Bugs LX
Gold Bugs LXI
Gold Bugs LXII
Gold Bugs LXIII
Gold Bugs LXIV
Gold Bugs LXV
Gold Bugs LXVI
Gold Bugs LXVII
Gold Bugs LXVIII
Gold Bugs LXIX
Gold Bugs LXX
Gold Bugs LXXI
Gold Bugs LXXII
Gold Bugs LXXIII
Gold Bugs LXXIV
Gold Bugs LXXV
Gold Bugs LXXVI
Gold Bugs LXXVII
Gold Bugs LXXVIII
Gold Bugs LXXIX
Gold Bugs LXXX
Gold Bugs LXXXI
Gold Bugs LXXXII
BITCOIN I
BITCOIN II
Day Trading I
Day Trading II
Day Trading III
Day Trading IV
Day Trading V
Day Trading VI
Day Trading VII
Day Trading VIII
Day Trading IX
Day Trading X
Day Trading XI
Day Trading XII
Day Trading XIII
Day Trading XIV
Day Trading XV
Day Trading XVI
Day Trading XVII
Day Trading XVIII
Day Trading XIX
Art I

Art II

Art III

 HOMESTEAD EXEMPTION
 HOMESTEAD EXEMPTION
Real Estate I
Real Estate II

Real Estate III
Real Estate IV
Real Estate V
Real Estate VI
Real Estate VII
Real Estate VIII
Real Estate IX
Real Estate X
Real Estate XI
Real Estate XII
Real Estate XIII
Real Estate XIV
Real Estate XV
Real Estate XVI
Real Estate XVII
Real Estate XVIII
Real Estate XIX
Real Estate XX
Real Estate XXI
Real Estate XXII
Real Estate XXIII
Real Estate XXIV

Real Estate XXV
Real Estate XXVI
Real Estate XXVII
Real Estate XXVIII
Real Estate XXIX
Real Estate XXX

Real Estate XXXI
Real Estate XXXII

Real Estate XXXIII

Real Estate XXXIV

Real Estate XXXV

Real Estate XXXVI

Real Estate XXXVII

Real Estate XXXVIII

Real Estate XXXIX

Real Estate XL

Real Estate XLI

Real Estate XLII
Real Estate XLIII
Real Estate XLIV
Real Estate XLV
Real Estate XLVI
Real Estate XLVII
BRIDGE LOAN I

BRIDGE LOAN II
BRIDGE LOAN III
BRIDGE LOAN IV
BRIDGE LOAN V

Banking I
Banking II
Banking III
Banking IV
Banking V
Banking VI
Banking VII
Banking VIII
Banking IX
Banking X

Banking XI

Banking XII
Banking XIII
Banking XIV
Banking XV
Banking XVI
RAFFLE I
RAFFLE II
RAFFLE III
RAFFLE IV
RAFFLE V
vox populi I
Diamonds I
Diamonds II
Diamonds III
Diamonds IV
Diamonds V
Diamonds VI
Diamonds VII
Diamonds VIII
Diamonds IX
Diamonds X
Diamonds XI
Diamonds XII
Diamonds XIII
Diamonds XIV
Charities I
Charities II
Charities III
Charities IV
Charities V
Charities VI

Charities VII

Charities VIII


Solar Power I
Solar Power II
Solar Power III
Solar Power IV
Solar Power V
Solar Power VI
Solar Power VII
Solar Power VIII
Solar Power IX
Solar Power X
Solar Power XI
Solar Power XII
Solar Power XIII
Solar Power XIV
Solar Power XV
Solar Power XVI
Solar Power XVII
Solar Power XVIII
Solar Power XIX
Solar Power XX
Gardening I
Gardening II
Gardening III
Gardening IV
Gardening V
Gardening VI
Gardening VII
Gardening VIII
Gardening IX
Gardening X
Gardening XI
Gardening XII
Gardening XIII
Gardening XIV
Gardening XV
Gardening XVI
Gardening XVII
Gardening XVIII
Gardening XIX
Gardening XX

Gardening XXI
Gardening XXII
Gardening XXIII
OBAMACARE I
OBAMACARE II
OBAMACARE III
OBAMACARE IV
OBAMACARE V
OBAMACARE VI
Hollywood I
Hollywood II
TAX I
TAX 2
TAX 3
TAX 4
TAX 5
STRESS I
STRESS II
STRESS III
TIMESHARE I
TIMESHARE II
TIMESHARE III
TIMESHARE IV
TIMESHARE V
INSURANCE I
INSURANCE II
VACATION I

VACATION II


Currencies/Currency cross rates


 Currency Converter


 CAPE RATIO


CONSUMER CONFIDENCE INDEX


AVERAGE HOURLY EARNINGS (click on chart for more info)

UNEMPLOYMENT RATE (official U-3) (click on chart for more info)

UNEMPLOYMENT RATE (unofficial U-6)

CPI=CONSUMER PRICE INDEX (click on chart for more info)

PPI=PRODUCER PRICE INDEX (Total manufacturing industries)
PRODUCER PRICE INDEX

PRODUCTIVITY (click on chart for more info)

Sentiment Survey
The Sentiment Survey measures INVESTORS who are bullish, bearish, and neutral for the next six months.

Are you BULLISH?

Investor Sentiment Survey
Bullish 36.3% Neutral 26.5% Bearish 37.2%
07/08/2026
Bullish 31.4% Neutral 26.4% Bearish 42.3%
07/01/2026
Bullish 44.9% Neutral 18.9% Bearish 36.1%
06/24/2026
Bullish 36.6% Neutral 24.1% Bearish 39.4%
06/17/2026

U.S. Weekly Leading Index (WLI), Future Inflation Gauge (FIG) and Leading Home Price Index (LHPI)
 ADVANCING Stocks vs. DECLINING Stocks
 ...from the desk of...CR...
1895 to 2026 History of the DOW JONES Industrials I
1895 to 2026 History of the DOW JONES Industrials II
1895 to 2026 History of the DOW JONES Industrials III
1895 to 2026 History of the DOW JONES Industrials IV
1895 to 2026 History of the DOW JONES Industrials V
 1895 to 2026 History of the DOW JONES Industrials VI
BOB BRINKER MARKET TIMER

TD AMERITRADE FIVE STAR STOCKS *****


MARKET LABORATORY


 The current position of the ISS SPACE STATION
 The current position of the ISS SPACE STATION
 The current position of the TIANGONG SPACE STATION
 The current position of the TIANGONG SPACE STATION
 The current position of the RUSSIA SPACE STATION (TBD 2025)
 The current position of the RUSSIA SPACE STATION (TBD 2025)

 SPIN LAUNCH 2022
 TheSkyLIVE
 EarthSky
 DR.SKY
 Sloan Digital Sky Survey (SDSS)
 Virtual Telescope Project 2.0
 BEHIND THE BLACK
 The Moon
 Planet Mars
 ASTEROIDS
 WWW.SPACE.COM
 North Korea Satellite
 Hubble Space Telescope
 LightSail 2
 Envisat
Fcast ---?? BANK Stocks
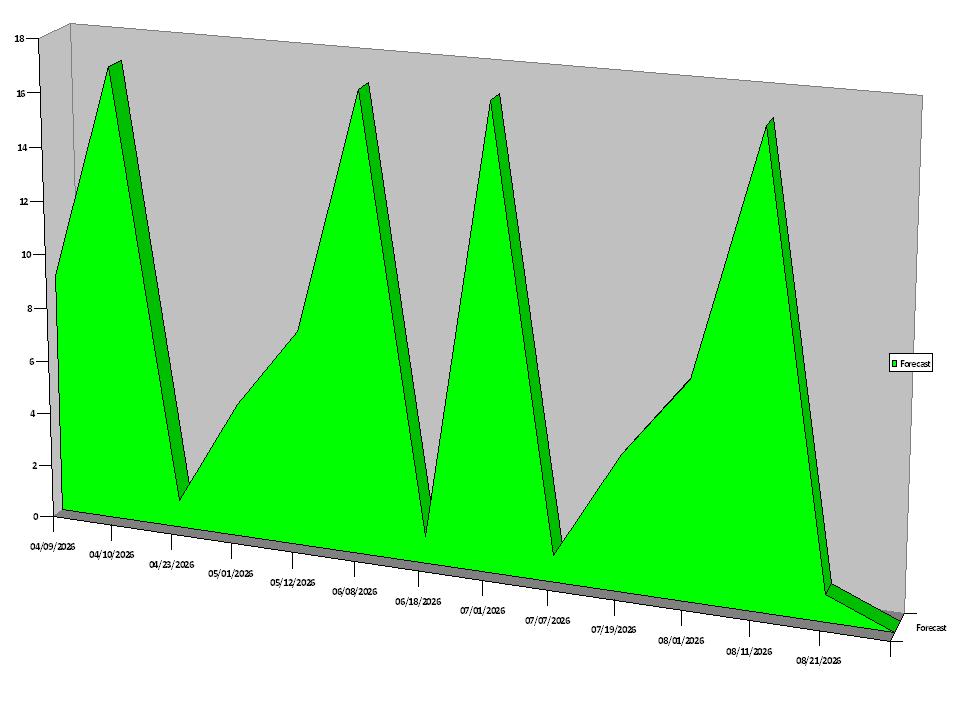
Fcast ---?? DRUG Stocks

The United States STOCK MARKET recommendation on 07/09/26 was ~~~~ Dow Jones was at 52925
The United States STOCK MARKET recommendation on 07/02/26 was ~~~~ Dow Jones was at 52650
The United States STOCK MARKET recommendation on 06/25/26 was SELL Dow Jones was at 51848
The United States STOCK MARKET recommendation on 06/18/26 was ~~~~ Dow Jones was at 51564
The United States STOCK MARKET recommendation on 06/11/26 was ~~~~ Dow Jones was at 49918
The United States STOCK MARKET recommendation on 06/04/26 was ~~~~ Dow Jones was at 51561
The United States STOCK MARKET recommendation on 05/28/26 was ~~~~ Dow Jones was at 50668
The United States STOCK MARKET recommendation on 05/21/26 was ~~~~ Dow Jones was at 50285
The United States STOCK MARKET recommendation on 05/14/26 was ~~~~ Dow Jones was at 50063
The United States STOCK MARKET recommendation on 05/08/26 was ~~~~ Dow Jones was at 49609
The United States STOCK MARKET recommendation on 05/01/26 was ~~~~ Dow Jones was at 49499
The United States STOCK MARKET recommendation on 04/23/26 was ~~~~ Dow Jones was at 49310
The United States STOCK MARKET recommendation on 04/16/26 was BUY! Dow Jones was at 48578
The United States STOCK MARKET recommendation on 04/09/26 was ~~~~ Dow Jones was at 48185
The United States STOCK MARKET recommendation on 04/03/26 was ~~~~ Dow Jones was at 46504
The United States STOCK MARKET recommendation on 03/27/26 was BUY! Dow Jones was at 45166
The United States STOCK MARKET recommendation on 03/19/26 was BUY! Dow Jones was at 46993
The United States STOCK MARKET recommendation on 03/12/26 was BUY! Dow Jones was at 46677
The United States STOCK MARKET recommendation on 03/05/26 was ~~~~ Dow Jones was at 47955
The United States STOCK MARKET recommendation on 02/26/26 was ~~~~ Dow Jones was at 49499
The United States STOCK MARKET recommendation on 02/19/26 was ~~~~ Dow Jones was at 49421
The United States STOCK MARKET recommendation on 02/13/26 was ~~~~ Dow Jones was at 49500
The United States STOCK MARKET recommendation on 02/06/26 was ~~~~ Dow Jones was at 50115
The United States STOCK MARKET recommendation on 01/30/26 was ~~~~ Dow Jones was at 48892
The United States STOCK MARKET recommendation on 01/23/26 was ~~~~ Dow Jones was at 49098
The United States STOCK MARKET recommendation on 01/16/26 was ~~~~ Dow Jones was at 49359
The United States STOCK MARKET recommendation on 01/08/26 was ~~~~ Dow Jones was at 49231
The United States STOCK MARKET recommendation on 01/01/26 was ~~~~ Dow Jones was at 48063
The United States STOCK MARKET recommendation on 12/25/25 was ~~~~ Dow Jones was at 48731
The United States STOCK MARKET recommendation on 12/19/25 was ~~~~ Dow Jones was at 48134
The United States STOCK MARKET recommendation on 12/11/25 was ~~~~ Dow Jones was at 48704
The United States STOCK MARKET recommendation on 12/05/25 was ~~~~ Dow Jones was at 47954
The United States STOCK MARKET recommendation on 11/28/25 was ~~~~ Dow Jones was at 47716
The United States STOCK MARKET recommendation on 11/20/25 was ~~~~ Dow Jones was at 45927
The United States STOCK MARKET recommendation on 11/14/25 was ~~~~ Dow Jones was at 47147
The United States STOCK MARKET recommendation on 11/07/25 was ~~~~ Dow Jones was at 46987
The United States STOCK MARKET recommendation on 10/31/25 was ~~~~ Dow Jones was at 47562
The United States STOCK MARKET recommendation on 10/24/25 was SELL Dow Jones was at 47207
The United States STOCK MARKET recommendation on 10/17/25 was ~~~~ Dow Jones was at 46190
The United States STOCK MARKET recommendation on 10/10/25 was ~~~~ Dow Jones was at 45479
The United States STOCK MARKET recommendation on 10/03/25 was SELL Dow Jones was at 46758
The United States STOCK MARKET recommendation on 09/26/25 was ~~~~ Dow Jones was at 46247
The United States STOCK MARKET recommendation on 09/19/25 was SELL Dow Jones was at 46315
The United States STOCK MARKET recommendation on 09/12/25 was SELL Dow Jones was at 45834
The United States STOCK MARKET recommendation on 08/29/25 was SELL Dow Jones was at 45545
The United States STOCK MARKET recommendation on 08/29/25 was SELL Dow Jones was at 45545
The United States STOCK MARKET recommendation on 08/22/25 was SELL Dow Jones was at 45282
The United States STOCK MARKET recommendation on 08/15/25 was ~~~~ Dow Jones was at 44176
The United States STOCK MARKET recommendation on 08/08/25 was ~~~~ Dow Jones was at 43999
The United States STOCK MARKET recommendation on 07/31/25 was ~~~~ Dow Jones was at 44131
The United States STOCK MARKET recommendation on 07/24/25 was SELL Dow Jones was at 44928
The United States STOCK MARKET recommendation on 07/18/25 was SELL Dow Jones was at 44342
Sector Performance (last 52 weeks)
Sector Performance (last 52 weeks SORTED)
UNITED STATES HOME PRICES by REGION

| Poll | USA | COUNTRY |
Right Direction
|
Wrong Track
|
Spread |
|---|---|---|---|---|---|
| RCP Average | *JULY* 2026 | -- | 34.6 | 58.4 | -23.8 |
Investor Sentiment Survey
Bullish 36.3% Neutral 26.5% Bearish 37.2%
07/08/2026
Bullish 31.4% Neutral 26.4% Bearish 42.3%
07/01/2026
Bullish 44.9% Neutral 18.9% Bearish 36.1%
06/24/2026
Bullish 36.6% Neutral 24.1% Bearish 39.4%
06/17/2026
ADVANCING Stocks vs. DECLINING Stocks...from the desk of...CR...1895 to 2026 History of the DOW JONES Industrials I
1895 to 2026 History of the DOW JONES Industrials II
1895 to 2026 History of the DOW JONES Industrials III
1895 to 2026 History of the DOW JONES Industrials IV
1895 to 2026 History of the DOW JONES Industrials V
BOB BRINKER MARKET TIMER
TD AMERITRADE FIVE STAR STOCKS *****
MARKET LABORATORY
The current position of the RUSSIA SPACE STATION (TBD 2025)
The current position of the RUSSIA SPACE STATION (TBD 2025)
Moon
CURRENT MOON
SPIN LAUNCH 2022TheSkyLIVEEarthSkyDR.SKYSloan Digital Sky Survey (SDSS)Virtual Telescope Project 2.0BEHIND THE BLACKThe MoonPlanet MarsASTEROIDSWWW.SPACE.COM
The United States STOCK MARKET
The United States STOCK MARKET recommendation on 07/02/26 was ~~~~ Dow Jones was at 52650
The United States STOCK MARKET recommendation on 06/25/26 was SELL Dow Jones was at 51848
The United States STOCK MARKET recommendation on 06/18/26 was ~~~~ Dow Jones was at 51564
The United States STOCK MARKET recommendation on 06/11/26 was ~~~~ Dow Jones was at 49918
The United States STOCK MARKET recommendation on 06/04/26 was ~~~~ Dow Jones was at 51561
The United States STOCK MARKET recommendation on 05/28/26 was ~~~~ Dow Jones was at 50668
The United States STOCK MARKET recommendation on 05/21/26 was ~~~~ Dow Jones was at 50285
The United States STOCK MARKET recommendation on 05/14/26 was ~~~~ Dow Jones was at 50063
The United States STOCK MARKET recommendation on 05/08/26 was ~~~~ Dow Jones was at 49609
The United States STOCK MARKET recommendation on 05/01/26 was ~~~~ Dow Jones was at 49499
The United States STOCK MARKET recommendation on 04/23/26 was ~~~~ Dow Jones was at 49310
The United States STOCK MARKET recommendation on 04/16/26 was BUY! Dow Jones was at 48578
The United States STOCK MARKET recommendation on 04/09/26 was ~~~~ Dow Jones was at 48185
The United States STOCK MARKET recommendation on 04/03/26 was ~~~~ Dow Jones was at 46504
The United States STOCK MARKET recommendation on 03/27/26 was BUY! Dow Jones was at 45166
The United States STOCK MARKET recommendation on 03/19/26 was BUY! Dow Jones was at 46993
The United States STOCK MARKET recommendation on 03/12/26 was BUY! Dow Jones was at 46677
The United States STOCK MARKET recommendation on 03/05/26 was ~~~~ Dow Jones was at 47955
The United States STOCK MARKET recommendation on 02/26/26 was ~~~~ Dow Jones was at 49499
The United States STOCK MARKET recommendation on 02/19/26 was ~~~~ Dow Jones was at 49421
The United States STOCK MARKET recommendation on 02/13/26 was ~~~~ Dow Jones was at 49500
The United States STOCK MARKET recommendation on 02/06/26 was ~~~~ Dow Jones was at 50115
The United States STOCK MARKET recommendation on 01/30/26 was ~~~~ Dow Jones was at 48892
The United States STOCK MARKET recommendation on 01/23/26 was ~~~~ Dow Jones was at 49098
The United States STOCK MARKET recommendation on 01/16/26 was ~~~~ Dow Jones was at 49359
The United States STOCK MARKET recommendation on 01/08/26 was ~~~~ Dow Jones was at 49231
The United States STOCK MARKET recommendation on 01/01/26 was ~~~~ Dow Jones was at 48063
The United States STOCK MARKET recommendation on 12/25/25 was ~~~~ Dow Jones was at 48731
The United States STOCK MARKET recommendation on 12/19/25 was ~~~~ Dow Jones was at 48134
The United States STOCK MARKET recommendation on 12/11/25 was ~~~~ Dow Jones was at 48704
The United States STOCK MARKET recommendation on 12/05/25 was ~~~~ Dow Jones was at 47954
The United States STOCK MARKET recommendation on 11/28/25 was ~~~~ Dow Jones was at 47716
The United States STOCK MARKET recommendation on 11/20/25 was ~~~~ Dow Jones was at 45927
The United States STOCK MARKET recommendation on 11/14/25 was ~~~~ Dow Jones was at 47147
The United States STOCK MARKET recommendation on 11/07/25 was ~~~~ Dow Jones was at 46987
The United States STOCK MARKET recommendation on 10/31/25 was ~~~~ Dow Jones was at 47562
The United States STOCK MARKET recommendation on 10/24/25 was SELL Dow Jones was at 47207
The United States STOCK MARKET recommendation on 10/17/25 was ~~~~ Dow Jones was at 46190
The United States STOCK MARKET recommendation on 10/10/25 was ~~~~ Dow Jones was at 45479
The United States STOCK MARKET recommendation on 10/03/25 was SELL Dow Jones was at 46758
The United States STOCK MARKET recommendation on 09/26/25 was ~~~~ Dow Jones was at 46247
The United States STOCK MARKET recommendation on 09/19/25 was SELL Dow Jones was at 46315
The United States STOCK MARKET recommendation on 09/12/25 was SELL Dow Jones was at 45834
The United States STOCK MARKET recommendation on 08/29/25 was SELL Dow Jones was at 45545
The United States STOCK MARKET recommendation on 08/29/25 was SELL Dow Jones was at 45545
The United States STOCK MARKET recommendation on 08/22/25 was SELL Dow Jones was at 45282
The United States STOCK MARKET recommendation on 08/15/25 was ~~~~ Dow Jones was at 44176
The United States STOCK MARKET recommendation on 08/08/25 was ~~~~ Dow Jones was at 43999
The United States STOCK MARKET recommendation on 07/31/25 was ~~~~ Dow Jones was at 44131
The United States STOCK MARKET recommendation on 07/24/25 was SELL Dow Jones was at 44928
The United States STOCK MARKET recommendation on 07/18/25 was SELL Dow Jones was at 44342
Sector Performance (last 52 weeks)
| |
|
|
|
| |
|
|
|
| |
|
|
|
| |
|
|
|
| |
|
|
|
| |
|
|
|
| |
|
|
|
| |
|
|
|
| |
|
|
|
| |
|
|
|
| |
|
|
|
| |
|
|
|
| |
|
|
|
| |
|
|
|
| |
|
|
|
| |
|
|
|
| |
|
|
|
| |
|
|
|
| |
|
|
|
| |
|
|
|
| |
|
|
|
| |
|
|
|
| |
|
|
|
| |
|
|
|
| |
|
|
|
| |
|
|
|
| |
|
|
|
| |
|
|
|
| |
|
|
|
| |
|
|
|
| |
|
|
|
| |
|
|
|
| |
|
|
|
| |
|
|
|
| |
|
|
|
| |
|
|
|
| |
|
|
|
| |
|
|
|
| |
|
|
|
| |
|
|
|
| |
|
|
|
| |
|
|
|
| |
|
|
|
| |
|
|
|
| |
|
|
|
| |
|
|
|
| |
|
|
|
| |
|
|
|
| |
|
|
|
| |
|
|
|
| |
|
|
|
| |
|
|
|
| |
|
|
|
| |
|
|
|
| |
|
|
|
| |
|
|
|
| |
|
|
|
| |
|
|
|
| |
|
|
|
| |
|
|
|
| |
|
|
|
| |
|
|
|
| |
|
|
|
| |
|
|
|
| |
|
|
|
| |
|
|
|
| |
|
|
|
| |
|
|
|
| |
|
|
|
| |
|
|
|
| |
|
|
|
| |
|
|
|
| |
|
|
|
| |
|
|
|
| |
|
|
|
| |
|
|
|
| |
|
|
|
| |
|
|
|
| |
|
|
|
| |
|
|
|
| |
|
|
|
| |
|
|
|
| |
|
|
|
| |
|
|
|
| |
|
|
|
| |
|
|
|
| |
|
|
|
| |
|
|
|
| |
|
|
|
| |
|
|
|
| |
|
|
|
| |
|
|
|
| |
|
|
|
| |
|
|
|
| |
|
|
|
| |
|
|
|
| |
|
|
|
| |
|
|
|
| |
|
|
|
| |
|
|
|
| |
|
|
|
| |
|
|
|
| |
|
|
|
| |
|
|
|
| |
|
|
|
| |
|
|
|
| |
|
|
|
| |
|
|
|
| |
|
|
|
| |
|
|
|
| |
|
|
|
| |
|
|
|
| |
|
|
|
| |
|
|
|
| |
|
|
|
| |
|
|
|
| |
|
|
|
| |
|
|
|
| |
|
|
|
| |
|
|
|
| |
|
|
|
Sector Performance (last 52 weeks SORTED)
| |
|
|
|
| |
|
|
|
| |
|
|
|
| |
|
|
|
| |
|
|
|
| |
|
|
|
| |
|
|
|
| |
|
|
|
| |
|
|
|
| |
|
|
|
| |
|
|
|
| |
|
|
|
| |
|
|
|
| |
|
|
|
| |
|
|
|
| |
|
|
|
| |
|
|
|
| |
|
|
|
| |
|
|
|
| |
|
|
|
| |
|
|
|
| |
|
|
|
| |
|
|
|
| |
|
|
|
| |
|
|
|
| |
|
|
|
| |
|
|
|
| |
|
|
|
| |
|
|
|
| |
|
|
|
| |
|
|
|
| |
|
|
|
| |
|
|
|
| |
|
|
|
| |
|
|
|
| |
|
|
|
| |
|
|
|
| |
|
|
|
| |
|
|
|
| |
|
|
|
| |
|
|
|
| |
|
|
|
| |
|
|
|
| |
|
|
|
| |
|
|
|
| |
|
|
|
| |
|
|
|
| |
|
|
|
| |
|
|
|
| |
|
|
|
| |
|
|
|
| |
|
|
|
| |
|
|
|
| |
|
|
|
| |
|
|
|
| |
|
|
|
| |
|
|
|
| |
|
|
|
| |
|
|
|
| |
|
|
|
| |
|
|
|
| |
|
|
|
| |
|
|
|
| |
|
|
|
| |
|
|
|
| |
|
|
|
| |
|
|
|
| |
|
|
|
| |
|
|
|
| |
|
|
|
| |
|
|
|
| |
|
|
|
| |
|
|
|
| |
|
|
|
| |
|
|
|
| |
|
|
|
| |
|
|
|
| |
|
|
|
| |
|
|
|
| |
|
|
|
| |
|
|
|
| |
|
|
|
| |
|
|
|
| |
|
|
|
| |
|
|
|
| |
|
|
|
| |
|
|
|
| |
|
|
|
| |
|
|
|
| |
|
|
|
| |
|
|
|
| |
|
|
|
| |
|
|
|
| |
|
|
|
| |
|
|
|
| |
|
|
|
| |
|
|
|
| |
|
|
|
| |
|
|
|
| |
|
|
|
| |
|
|
|
| |
|
|
|
| |
|
|
|
| |
|
|
|
| |
|
|
|
| |
|
|
|
| |
|
|
|
| |
|
|
|
| |
|
|
|
| |
|
|
|
| |
|
|
|
| |
|
|
|
| |
|
|
|
| |
|
|
|
| |
|
|
|
| |
|
|
|
| |
|
|
|
| |
|
|
|
| |
|
|
|
| |
|
|
|
| |
|
|
|
UNITED STATES HOME PRICES by REGION
| 39 year
|
|
||||||||||||
|---|---|---|---|---|---|---|---|---|---|---|---|---|---|
| High....... | Low........ | City | Home Price April.2026 |
$$$.......... 1 year |
$$$.......... 2 years |
$$$.......... 3 years |
$$$.......... 4 years |
$$$.......... 5 years |
$$$.......... 10 years |
$$$.......... 15 years |
$$$.......... 20 years |
$$$.......... 39 years |
|
| |
|
|
|
|
|
|
|
|
|
|
|
|
|
| |
|
|
|
|
|
|
|
|
|
|
|
|
|
| |
|
|
|
|
|
|
|
|
|
|
|
|
|
| |
|
|
|
|
|
|
|
|
|
|
|
|
|
| |
|
|
|
|
|
|
|
|
|
|
|
|
|
| |
|
|
|
|
|
|
|
|
|
|
|
|
|
| |
|
|
|
|
|
|
|
|
|
|
|
|
|
| |
|
|
|
|
|
|
|
|
|
|
|
|
|
| |
|
|
|
|
|
|
|
|
|
|
|
|
|
| |
|
|
|
|
|
|
|
|
|
|
|
|
|
| |
|
|
|
|
|
|
|
|
|
|
|
|
|
| |
|
|
|
|
|
|
|
|
|
|
|
|
|
| |
|
|
|
|
|
|
|
|
|
|
|
|
|
| |
|
|
|
|
|
|
|
|
|
|
|
|
|
| |
|
|
|
|
|
|
|
|
|
|
|
|
|
| |
|
|
|
|
|
|
|
|
|
|
|
|
|
| |
|
|
|
|
|
|
|
|
|
|
|
|
|
| |
|
|
|
|
|
|
|
|
|
|
|
|
|
| |
|
|
|
|
|
|
|
|
|
|
|
|
|
| |
|
|
|
|
|
|
|
|
|
|
|
|
|